

· 8 min read
A NestJS Logging Setup That Actually Tells You What Happened
Plenty of NestJS logs, none useful when it matters — no way to trace a request, errors reworded vaguer on the way up. That gap is the topic here.
Why plain console output stops working?
NestJS ships with its own Logger out of the box, and for a weekend project it is genuinely fine. It prints readable lines, tags them with the class that sent them, and needs zero setup. The trouble starts the moment more than one request is being handled at once. Plain text lines from five concurrent requests interleave in your terminal with nothing telling you which line belongs to which request. You cannot easily search them. You cannot ship them anywhere that expects structured data. And every write happens synchronously, on the same thread that is also trying to serve traffic.
None of that is really a flaw. It just is not what a logger for a real service needs to do.
One id per request, and logs a machine can read?
The service uses nestjs-pino instead, a package that wires pino into Nest as both the application logger and as request handling middleware. The setup lives in app.module.ts and looks roughly like this:
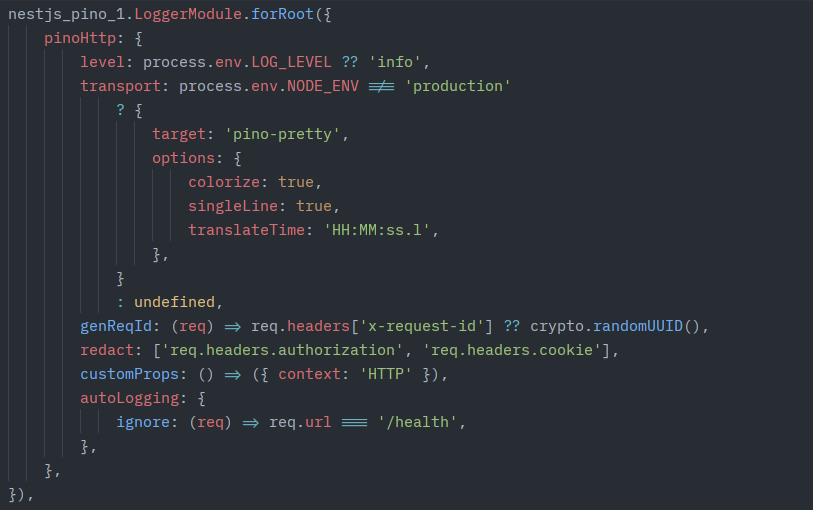
Picture 1: nestjs-pino configuration block
Two lines matter more than the rest.
- the genReqId gives every incoming request its own id, and every single log line written while handling that request, no matter which service wrote it, carries that same id automatically.
- the redact strips things like the authorization header before they ever touch disk.
In development the output flows through pino-pretty so it stays readable while you work. In production it is raw JSON, ready for whatever actually reads your logs later, whether that is a person grepping through files or a proper log platform.
The mistake almost everyone makes
Once your logs are structured, the next question is where you actually call logger.error. My first instinct, and I suspect most people’s first instinct, is to wrap everything in try and catch and log right there before rethrowing, because that feels responsible. It is exactly the wrong move.
The application has an order endpoint that calls a service, which calls another service, which calls a third one that talks to a simulated warehouse. If every one of those catches the failure, logs it, and throws again, a single broken order produces three or four nearly identical stack traces in the log stream. Log volume alone will not tell you whether you are looking at one bug or four, and determining which line actually explains what happened becomes its own investigation.
The fix is boring on purpose. Errors just propagate. Nothing in orders.service.ts or inventory.service.ts logs anything when something goes wrong, they simply let it bubble up. The only place that ever writes an error log is one filter that catches everything right before it becomes an HTTP response:
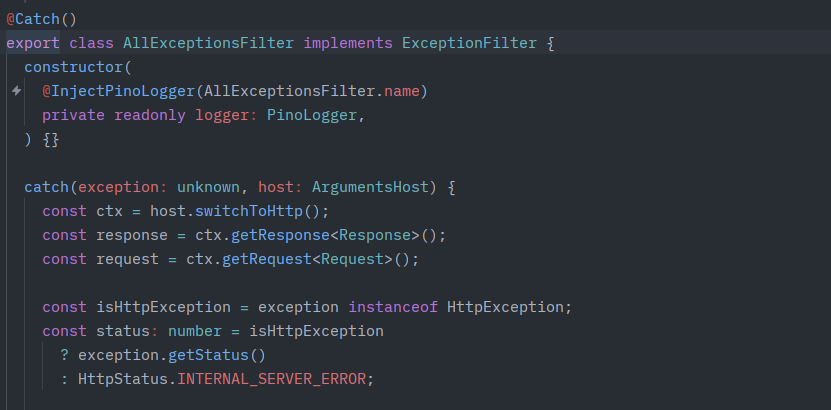
Picture 2: Class AllExceptionsFilter code example
That filter also decides how loud to be. A customer ordering something that is out of stock is not a bug, it is an expected outcome, so it gets logged as a warning and nobody is paged for it. Anything that was not a deliberate, expected rejection gets logged as a genuine error, since that one likely needs a person to investigate.
Keeping the story straight across three services
Logging once is only half the answer, though. By the time an error reaches that single filter, you have lost which service it came from and what data it was working on, unless you carry that information along with the error itself instead of writing it into a log line that gets thrown away at each layer.
This is where the inventory service earns its keep. When it cannot reserve stock it does not just throw a generic error, it wraps whatever went wrong underneath into a domain specific exception and keeps the original error attached as the cause:

Picture 3: Try/Catch block example that handles every error at one point
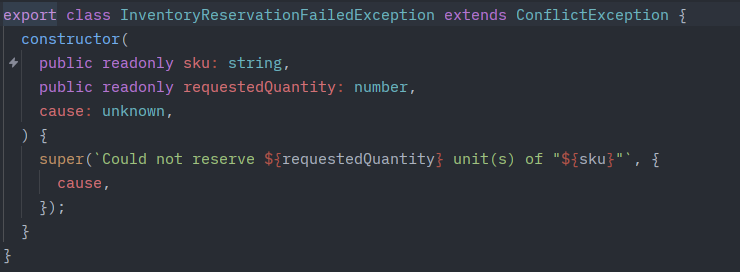
Figure 4: Error causes example
Node has supported error causes natively for a while now, and pino actually understands them. Ask for a product that does not exist in the warehouse and the single log line the filter writes ends up looking like this:
InventoryReservationFailedException: Could not reserve 1 unit(s) of "UNKNOWN-SKU"
    at InventoryService.reserve (...)
    at OrdersService.createOrder (...)
caused by: Error: Unknown SKU "UNKNOWN-SKU": warehouse system returned no record
    at WarehouseService.checkStock (...)
One log line, one complete picture, all the way down to the exact call that failed, three layers deep. The sku and quantity are also attached as their own structured fields rather than baked into a message string, which sounds like a small thing until you actually try to search your logs for every failed reservation of one particular product.
Knowing what happened even when nothing broke
All of the above only fires when something goes wrong. Most requests do not go wrong, and you still occasionally want to know which handler ran and how long it took, without turning that into noise for every single request in production.
The project has one interceptor for that, and it logs at debug rather than info specifically so it stays invisible unless more detail has actually been requested:
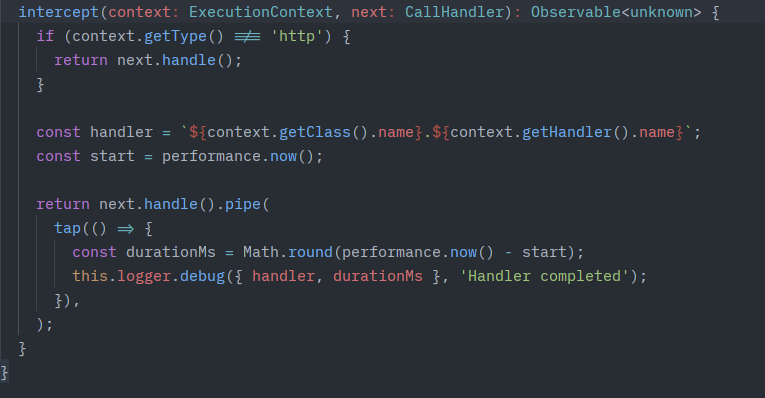
Picture 5: Interceptor code example
It is intentionally simple and it never touches errors. Catching failures here too would just recreate the same duplicate logging problem the filter already solves.
Turning the volume up for one request, not the whole fleet
Sometimes info level logs are not enough to understand a specific failing request, but flipping the entire service over to debug logging is a poor trade, both in cost and in how much noise there is to wade through afterward. The service lets a single request opt into debug logging through a header, checked against a secret the client cannot guess:
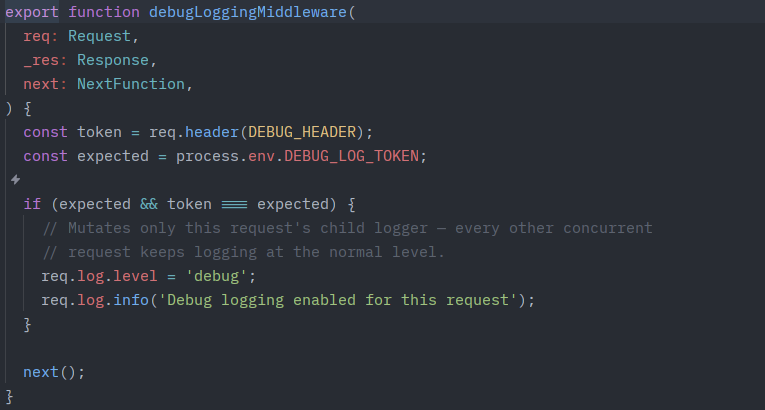
Picture 6: debugLoggingMiddleware, for switching debug logging at request level
- Good to know: There is an important detail to pay attention to when registering middlewares in NestJS: the registration method and ordering can affect whether the middleware has access to the context it depends on. A plain app.use call made immediately after creating the Nest application can run before middleware registered through modules, because Nest only binds module-registered middlewares when the application actually starts listening.
For middleware that depends on another middleware, such as a logger being attached to each request, matter. Therefore it is important to register them through the same mechanism. Using the module configure method, as nestjs-pino does for its own middleware, ensures that both are bound during the same phase and in a predictable order.
This is an important implementation detail that may not be obvious from the application code alone and is worth verifying when middleware depends on other middleware being initialized first.
Logs when nobody sent a request
Not everything happens inside an HTTP request. This service reconciles its stock on a schedule, and a scheduled job has no request to hang a correlation id off of. The fix is to create one by hand:
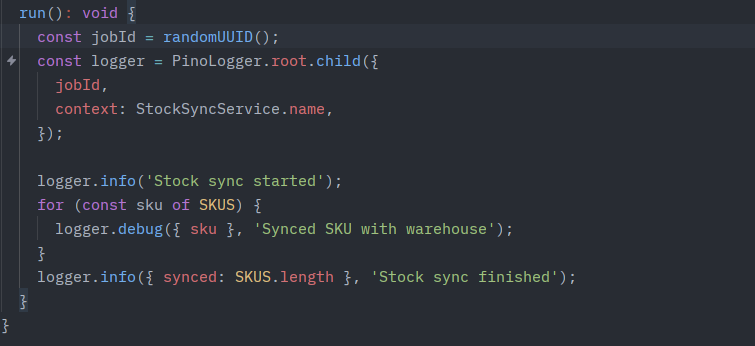
Picture 7: CronJob logging example
Every log line for that run shares the same made up id, the same way every log line in a request shares its request id. It is a smaller version of the same idea, just done by hand instead of automatically.
Good to know: There is an important detail to keep in mind when handling errors in scheduled jobs: an error is only useful from an operational perspective if it is actually caught and logged in a structured and traceable way. If a job throws an error without any explicit error handling, the scheduler’s default behavior may be much more limited than expected.
In this case, the scheduler library falls back to a simple console.error. The resulting log contains no structure, job identifier, or context that would connect it to the rest of the application’s log stream.
For this reason, it is worth explicitly handling errors in scheduled jobs and making sure they are logged through the application’s logging mechanism. This is an important implementation detail that may not be obvious from the framework itself and is worth checking before relying on the scheduler’s default error handling.
Summary
If I had to compress all of this into one sentence, it would be that logs exist for a version of you that has forgotten everything about the incident except what is on the screen in front of them.
- Structure your logs so a machine can search them.
- Give every request an id so you can follow it across services.
- Log failures exactly once, in one place, and carry enough context with the error itself that the log written at that one place still tells the whole story.
Everything else is just detail.
Are you interested in this topic? Do you have any questions about the article? Book a free consultation and let’s see how the Code Factory team can help you, or take a look at our services!